Soil Spectroscopy: SWIR Improves Carbon and Nitrogen Estimation
Soil spectroscopy offers researchers a rapid, non-destructive way to extract information about soil composition, but predictive performance depends heavily on whether the measurement includes the wavelengths that carry meaningful information about the property being studied.
Key Takeaways
Soil spectroscopy performance depends strongly on spectral range. In this study, models using full-range or SWIR data from the SVC HR-1024i substantially outperformed models limited to VNIR wavelengths for both soil organic carbon and soil nitrogen estimation.
SWIR contained many of the most informative wavelengths. Band-selection analysis identified useful regions between approximately 980 and 2400 nm, with particularly strong contributions between 2150 and 2400 nm.
Model choice mattered, but access to the right spectral information mattered more. PLSR, LASSO, and GPR all improved markedly when SWIR wavelengths were included.
The SVC HR-1024i supported a practical field-laboratory workflow. Paired with the LC-RP PRO contact probe and internal illumination source, the instrument enabled controlled measurements without a separate external lighting setup.
Spectroscopy complements rather than eliminates laboratory analysis. Reference measurements remain necessary for calibration and validation, but spectroscopy can help extend those measurements across larger sample populations.
That distinction is particularly important for soil organic carbon (SOC) and soil nitrogen (SN). Both are central to understanding soil condition, agricultural productivity, nutrient cycling, and carbon dynamics, yet conventional laboratory analysis becomes increasingly expensive and logistically difficult as sampling programs grow.
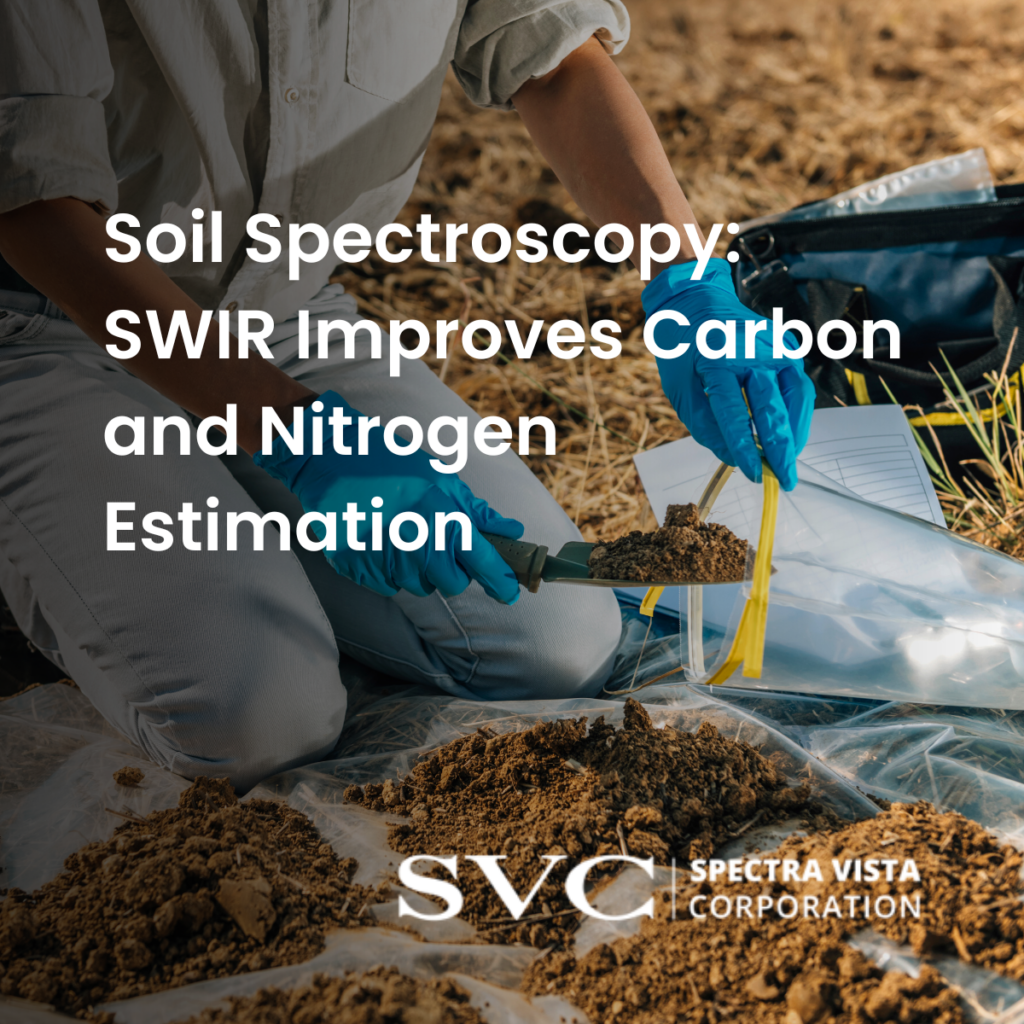
A study published in Catena examined whether field spectroscopy could provide a practical complementary method for estimating SOC and SN from agricultural soils. Researchers analyzed 157 soil samples collected across the Taita Hills of Kenya and compared laboratory reference measurements with spectral estimates produced using several regression models and wavelength ranges.
The results point to a clear technical conclusion: including shortwave infrared (SWIR) wavelengths substantially improved the estimation of both soil organic carbon and nitrogen. Using spectral measurements from an SVC HR-1024i field spectroradiometer, the strongest SOC model achieved an R² of 0.83 and RMSE of 0.36%, while the strongest nitrogen model reached an R² of 0.70 with RMSE of 0.07%. Models restricted to the visible and near-infrared region performed considerably less well.
The study therefore illustrates a broader consideration in hyperspectral measurement: model sophistication matters, but the information available to the model matters first.
Soil Spectroscopy as a Complement to Conventional Laboratory Analysis
Soil organic carbon influences physical, chemical, and biological soil functions, including water and nutrient retention, microbial activity, soil fertility, and resistance to erosion. Nitrogen is likewise fundamental to plant growth and agricultural productivity.
Obtaining quantitative measurements of these properties traditionally requires laboratory analysis. Common methods include wet oxidation or dry combustion for carbon and Kjeldahl analysis for nitrogen. These approaches remain important reference techniques, but they can also require considerable time, sample preparation, laboratory infrastructure, and transportation.
Those constraints become particularly significant when researchers need to analyze hundreds or thousands of samples or operate in areas where well-equipped laboratories are not readily accessible.
Reflectance spectroscopy offers a complementary approach.
Instead of directly performing chemical analysis on every sample, researchers measure the interaction of light with the soil across a range of wavelengths. Statistical or machine-learning models can then relate spectral characteristics to laboratory-measured soil properties.
The laboratory measurements do not disappear from the process. They provide the reference data necessary to calibrate and validate the spectral models. Once a robust relationship has been established, however, spectroscopy can potentially allow much larger sample sets to be screened rapidly.
The practical question is therefore not whether spectroscopy eliminates conventional soil analysis. It is whether a calibrated spectral measurement workflow can extend the value of laboratory measurements across larger sample populations.
The Taita Hills study was designed around exactly that problem.
Comparing Spectral Range for Soil Organic Carbon and Nitrogen Estimation
Researchers collected agricultural soil samples along a roughly 30-kilometer lowland-to-highland transect in the Taita Hills of southeastern Kenya. The dataset included samples from cropland, sisal plantations, agroforestry, and shrubland.
The sampling strategy intentionally incorporated variation in geographic position, elevation, land cover, soil color, texture, and carbon content. Each sample incorporated soil collected from three points to a depth of 20 centimeters. A total of 157 agricultural samples were included in the modeling work.
Reference SOC and SN concentrations were determined through laboratory analysis. The same samples were then characterized spectrally, allowing the researchers to compare known concentrations with predictions derived from reflectance measurements.
Full-Range Measurements with the SVC HR-1024i
Technical Highlight: The Difference SWIR Made
For soil organic carbon:
- Best VNIR model: R² = 0.61
- Best full-range model: R² = 0.83
- Best SWIR model: R² = 0.83
- Lowest SWIR RMSE: 0.36%
For soil nitrogen, the same pattern emerged. VNIR-only models produced R² values between 0.39 and 0.49, while the strongest full-range model reached R² = 0.70 with an RMSE of 0.07%.
For field spectroradiometer measurements, the researchers used an SVC HR-1024i, which captures wavelengths from 350 to 2500 nm across 1024 spectral channels and three detector regions.
The spectroradiometer was paired with an SVC LC-RP PRO Leaf-Clip Reflectance-Probe, which incorporates an internal tungsten-halogen light source. Although designed for contact reflectance measurements, the researchers developed a controlled protocol that used the probe for prepared soil samples.
Samples were placed in Petri dishes and their surfaces smoothed to improve reflection and signal-to-noise ratio. The LC-RP PRO was held in a fixed position over the sample. Researchers collected three measurements from different areas of each sample, using a white reference between samples while the instrument automatically acquired dark-current measurements.
The experimental configuration is shown in Figure 3 of the original paper, where the HR-1024i and LC-RP PRO can be seen mounted over the prepared soil sample.
This measurement approach established a controlled field-laboratory workflow while retaining access to the full VIS-NIR-SWIR spectral range.
Separating Spectral Range from Modeling Method
The researchers then divided the field spectroradiometer data into three spectral datasets:
- VNIR: 400 to 1000 nm
- SWIR: 1000 to 2400 nm
- Full wavelength range: 400 to 2400 nm
Three regression approaches were evaluated independently against each spectral range: Partial Least Squares Regression (PLSR), Least Absolute Shrinkage and Selection Operator (LASSO), and Gaussian Process Regression (GPR).
This experimental design allowed two different questions to be examined independently: which modeling approach worked best, and which wavelengths provided the information needed by those models.
That distinction turned out to be significant.
SWIR Soil Spectroscopy Significantly Improved SOC Prediction
For soil organic carbon, the strongest differences were associated with spectral range.
When models were restricted to VNIR wavelengths, the best SOC result reached an R² of 0.61 with an RMSE of 0.55%. PLSR and GPR models using the same wavelength region produced still lower R² values.
Adding the SWIR region changed the results substantially.
Across the full wavelength range, all three modeling approaches produced R² values of approximately 0.82 to 0.83, with RMSE values between 0.37 and 0.38%. SWIR alone produced almost identical performance, with the best model reaching R² = 0.83 and RMSE = 0.36%.
The results are especially clear in Figure 5 of the study. Predictions from VNIR measurements exhibit noticeably greater dispersion from the measured values. Full-range and SWIR predictions cluster substantially more closely around the 1:1 relationship between measured and predicted SOC.
Perhaps more importantly, the three regression methods produced very similar SOC results once SWIR information was available.
That finding deserves attention.
Machine-learning selection often receives considerable emphasis in spectral modeling, yet a sophisticated regression method cannot compensate for information that was never captured by the sensor. In this experiment, the largest improvement came from extending the spectral information available to the models.
Soil Nitrogen Followed the Same Spectral Pattern
Nitrogen proved more challenging to estimate than organic carbon, but its results followed much the same pattern.
VNIR-only field spectroscopy models achieved R² values between 0.39 and 0.49. When the full 400 to 2400 nm range was used, the best GPR model reached R² = 0.70 with RMSE = 0.07%.
SWIR measurements by themselves approached that performance, with the best SWIR model reaching an R² of 0.67.
So while the absolute predictive performance differed between SOC and nitrogen, both analyses pointed in the same direction: measurements extending beyond 1000 nm contained information that was important to the models.
Why SWIR Wavelengths Carry More Information About Soil Carbon and Nitrogen
The advantage of SWIR is not simply that it adds more spectral channels.
Different portions of the electromagnetic spectrum respond to different physical and chemical characteristics of soil.
In the visible region, soil reflectance is strongly affected by color and chromophores such as iron oxides. As measurements extend into the near-infrared and shortwave infrared, absorption behavior associated with water, clay minerals, organic matter, and molecular vibrations becomes increasingly important.
The researchers tested this directly using LASSO not only as a predictive method, but also as a tool for identifying wavelengths that contributed most strongly to SOC and SN modeling.
Informative Bands Clustered Toward Longer Wavelengths
The band-selection results showed that most informative wavelengths occurred between approximately 980 and 2400 nm.
Bands near 980 and 1360 nm were repeatedly selected for both carbon and nitrogen. More strikingly, selected wavelengths became increasingly concentrated between approximately 2150 and 2400 nm.
Relatively few visible wavelengths were consistently selected across the cross-validation folds.
The researchers connected the longer wavelengths to overtone absorption associated with molecular bonds including C-H, C=O, N-H, O-H, and S-H. Previous soil spectroscopy research has likewise identified wavelengths around 2200 and 2300 nm as particularly informative for organic carbon calibration.
Technical Highlight: Where the Informative Bands Were Found
LASSO band-selection analysis showed that many of the wavelengths contributing to SOC and SN prediction occurred in the NIR and SWIR regions rather than the visible spectrum.
The researchers identified repeated contributions near 980 nm and 1360 nm, with particularly strong band selection from approximately 2150 to 2400 nm. These longer wavelengths include overtone absorption associated with molecular bonds such as C-H, C=O, N-H, O-H, and S-H.
The implication is straightforward.
The performance advantage of SWIR did not arise simply because the models had a larger dataset of wavelengths to work with. Extending the measurement into SWIR gave the models access to portions of the spectrum where constituents relevant to carbon and nitrogen estimation produce useful spectral information.
That distinction matters when selecting instrumentation for quantitative soil spectroscopy.
A narrower spectral instrument may still offer useful information for some applications, but if the property of interest is associated with absorption features beyond its wavelength range, no downstream modeling technique can reconstruct those missing measurements.
Building a Practical Field-Laboratory Soil Spectroscopy Workflow
Spectral accuracy was only one objective of the study.
The researchers were also interested in whether proximal spectroscopy could help address a practical constraint common to agricultural and environmental research: analyzing large sample populations in locations where conventional laboratory infrastructure may be distant or limited.
That makes the experimental configuration itself noteworthy.
Controlled Illumination Without a Full Optical Laboratory Setup
The HR-1024i and LC-RP PRO combination provided an internal illumination source for the contact measurements. As the authors note, this reduces dependence on ambient lighting and eliminates the need to construct a separate external illumination configuration for each measurement.
Controlled illumination is particularly important in reflectance spectroscopy because changing illumination geometry or intensity can introduce variability unrelated to the soil property being investigated.
Using a fixed contact probe, internal source, repeatable sample preparation, white referencing, and multiple measurements provided the researchers with a straightforward protocol for controlling these variables.
The approach does not eliminate sample preparation. The soils used in this experiment were air-dried, sieved, and presented under controlled conditions. It does, however, demonstrate that useful quantitative spectral measurements do not necessarily require a conventional spectroscopy laboratory.
Simpler Spectral Data Processing
Point spectroscopy and imaging spectroscopy also produce very different types of data.
The HR-1024i generated spectral signature files containing spectral values and associated metadata. After quality control and preprocessing, the three measurements for each soil sample could be averaged and passed into the modeling pipeline.
Hyperspectral imaging provides additional spatial information, but it also produces multidimensional image data. In this study, image processing was required to identify the soil area, remove the Petri-dish border and background, remove noisy bands, and calculate representative spectral values across the image.
The authors specifically identify the simpler file structure and processing workflow associated with field spectroradiometer measurements as an advantage for field laboratories with limited computational resources.
Neither approach is universally preferable.
Imaging spectroscopy can capture spatial variation within a sample that a point measurement cannot. Field spectroradiometry provides a more direct route when the objective is to acquire a representative full-range spectrum from a prepared sample.
The measurement strategy should therefore follow the scientific question rather than the instrument category.
What the Results Mean for Higher-Throughput Soil Monitoring
The research does not establish a universal spectral model for measuring carbon or nitrogen in every soil.
The samples came from a single region of Kenya, and the authors explicitly identify model transferability to other agricultural regions as an important subject for future work. Differences in soil mineralogy, texture, moisture, organic matter composition, and other environmental variables can alter spectral relationships.
That limitation is important, particularly for any proposed operational soil-monitoring system.
But the study demonstrates several principles that extend beyond the specific dataset.
First, the property being estimated should help determine the wavelength range being measured. If important information occurs in SWIR, restricting measurements to VNIR places an upper limit on what subsequent modeling can extract.
Second, spectral range and modeling method are not interchangeable considerations. PLSR, LASSO, and GPR produced different results, but the study’s clearest performance difference occurred when SWIR information became available.
Third, laboratory reference analysis remains fundamental. Spectroscopy becomes quantitative through calibration against known samples. The value lies in using those reference measurements to support rapid estimation across larger datasets.
Finally, measurement protocols matter. Repeatable illumination, referencing, sample presentation, spectral preprocessing, and validation are all part of the analytical system. An instrument’s wavelength specification alone does not produce a reliable soil model.
Those considerations are relevant to regenerative agriculture research, soil-carbon studies, precision agriculture, carbon monitoring programs, and other projects where increasing sample density can improve understanding of spatial and temporal soil variability.
Spectral Range Before Algorithm Complexity
Machine learning continues to expand what researchers can extract from hyperspectral datasets. In this study, Gaussian Process Regression produced the strongest individual predictions for both SOC and nitrogen.
But the more fundamental result occurred upstream of the algorithm.
When measurements were limited to VNIR wavelengths, all three models struggled. When the researchers supplied full-range or SWIR spectra, SOC performance improved sharply across PLSR, LASSO, and GPR alike.
The band-selection analysis helped explain why. Many of the wavelengths most useful for predicting carbon and nitrogen occurred deep in the SWIR, particularly between approximately 2150 and 2400 nm.
For researchers designing soil spectroscopy workflows, that is a useful reminder: model complexity cannot recover spectral information that was never measured.
In this study, the SVC HR-1024i provided the 350 to 2500 nm spectral coverage needed to investigate those longer wavelengths, while the LC-RP PRO enabled a controlled contact-measurement protocol suitable for field-laboratory conditions.
For applications involving soil carbon, nitrogen, and other properties with diagnostically useful SWIR information, selecting the appropriate spectral range is not merely an instrumentation decision. It is part of the analytical method itself.
How much does spectral range matter when estimating soil carbon and nitrogen?
Frequently Asked Questions
What is soil spectroscopy?
Soil spectroscopy measures how soil reflects or absorbs light at different wavelengths. These spectral patterns can be correlated with laboratory-measured soil properties such as organic carbon, nitrogen, moisture, clay content, and other constituents. Once calibrated against reference measurements, spectral models can be used to estimate soil properties more rapidly across larger sample sets.
Why is SWIR important in soil spectroscopy?Add Your Heading Text Here
Shortwave infrared wavelengths contain absorption features associated with water, clay minerals, organic matter, and molecular bonds relevant to soil composition. In the Mahmud et al. study, SOC and nitrogen models using SWIR or full-range spectra substantially outperformed models restricted to VNIR wavelengths.
Which wavelengths were most useful for estimating soil organic carbon?
The study’s band-selection analysis identified informative wavelengths across approximately 980 to 2400 nm, with particularly strong selection between 2150 and 2400 nm. Wavelengths around 2200 and 2300 nm have also been identified in previous research as useful for SOC calibration.
Can VNIR spectroscopy estimate soil organic carbon?
Yes, but performance may be limited depending on the concentration range and soil conditions. In this study, the best VNIR-only SOC model reached an R² of 0.61, while models using SWIR or the full 400 to 2400 nm range reached approximately 0.83.
Can spectroscopy be used to estimate soil nitrogen?
Yes. The researchers successfully modeled soil nitrogen using spectral measurements, although predictive performance was lower than for organic carbon. The best full-range model reached R² = 0.70 with RMSE = 0.07%, while VNIR-only models performed considerably less well.
Does machine learning compensate for limited spectral range?
Not necessarily. The study compared PLSR, LASSO, and Gaussian Process Regression and found that all three improved when SWIR wavelengths were included. This suggests that model sophistication cannot fully compensate for spectral information that was not captured during measurement.
Can soil spectroscopy replace laboratory soil analysis?
Not completely. Laboratory measurements are still required to provide reference values for calibration and validation. Spectroscopy is best viewed as a complementary method that can potentially extend a calibrated laboratory dataset across a larger number of samples and reduce the amount of intensive analysis required.
What was the SVC HR-1024i used for in this study?
The SVC HR-1024i was used to acquire full-range reflectance spectra from prepared agricultural soil samples. Researchers paired it with the SVC LC-RP PRO contact probe and used the resulting spectra to model SOC and soil nitrogen across VNIR, SWIR, and full wavelength ranges.
Why use a contact probe for soil spectroscopy?
A contact probe with an internal light source can provide more controlled illumination and measurement geometry than relying on ambient lighting. In this study, the LC-RP PRO helped researchers establish a repeatable protocol for prepared soil samples in field-laboratory conditions.
What are the limitations of this soil spectroscopy study?
The dataset came from one region of Kenya, so the resulting models should not be assumed to transfer directly to other soils or geographic regions. The authors specifically identify model transferability as an area for future research. Differences in mineralogy, texture, organic matter composition, moisture, and other soil characteristics can affect spectral relationships.