
Field Spectroscopy for Hyperspectral Remote Sensing and Machine Learning
Researchers used an SVC HR-1024i to develop a winter wheat photosynthesis model and applied it to UAV imagery collected in a later growing season.
Hyperspectral crop monitoring was the focus of a winter wheat study that connected measurements of individual leaves with aerial images of experimental fields. Using leaf reflectance collected with an SVC HR-1024i spectroradiometer, researchers developed a model to estimate net photosynthetic rate. They then adjusted UAV-derived spectral inputs to apply the model at canopy scale.
Published in Frontiers in Plant Science on September 3, 2026, the study by Menglei Dai and colleagues examined whether a model developed from ground measurements could be extended to a different sensing platform and growing season. The work demonstrates how leaf-level spectral measurements can support spatial estimates of photosynthetic activity across experimental fields.
Connecting spectral measurements with photosynthetic activity
Research at a glance
- Study location: Xinji City, Hebei Province, China.
- Experiments: The 2021–2022 and 2023–2024 winter wheat growing seasons.
- Ground measurements: HR-1024i leaf reflectance and LI-6800 measurements of net photosynthetic rate.
- Aerial measurements: A DJI M300 UAV equipped with a Cubert X20 Pro hyperspectral camera.
- Best reported configuration: Vegetation indices selected using the Successive Projections Algorithm and modeled with random forest regression.
- Reported validation results: R² of 0.8457 and root mean square error of 2.4299 μmol m⁻² s⁻¹, as presented in Figure 8 and the conclusion.
The authors identify net photosynthetic rate as an indicator of crop photosynthetic capacity. They describe conventional gas-exchange measurements as accurate but time-consuming and labor-intensive, creating a challenge for high-throughput field monitoring.
Their approach began with paired physiological and spectral observations. The team used an LI-COR LI-6800 photosynthesis system to measure net photosynthetic rate, taking three readings per leaf and averaging them. Spectral data were collected on the same day.
The experiments included four irrigation treatments and five nitrogen application rates. Those contrasting conditions produced differences in photosynthetic activity and reflectance for the researchers to examine.
The HR-1024i's role in the experiment
In the first experiment, the researchers used the HR-1024i to collect leaf hyperspectral reflectance. Measurements followed calibration with a standard white reference panel. Individual leaves were clamped at their middle position, and five replicate spectral measurements were collected per leaf.
The team removed outliers from those repeated readings and calculated an average spectrum. These reflectance measurements, together with measured net photosynthetic rate, supplied the observations used to develop the estimation models.
This is the documented SVC contribution to the study: leaf spectral data for establishing and testing the relationship between reflectance and photosynthetic rate. The aerial imagery came from a separate instrument in the second experiment.
Comparing approaches to hyperspectral crop monitoring
The researchers compared models built from raw reflectance with models built from vegetation indices. They used two methods to select input features: Competitive Adaptive Reweighted Sampling, or CARS, and the Successive Projections Algorithm, or SPA.
They then tested two modeling approaches, random forest and partial least squares regression, producing eight configurations. The paper describes a dataset of 100 experimental samples and a random 4:1 training-to-validation split, with grid search and five-fold cross-validation used during model development.
The vegetation-index model combining SPA with random forest produced the strongest reported validation result. Figure 8 and the conclusion give a training R² of 0.8907 and a validation R² of 0.8457. The corresponding root mean square errors were 1.8504 and 2.4299 μmol m⁻² s⁻¹.
The authors attribute random forest’s performance to its ability to represent nonlinear relationships among spectral variables and photosynthetic activity. Their discussion connects those relationships with interacting influences such as leaf nitrogen status, stomatal conductance and canopy structure.
These model-validation figures relate to the comparison presented in Figure 8. The paper discusses the later UAV application separately through its spatial maps and descriptions of treatment and growth-stage differences.
Applying the model to UAV imagery
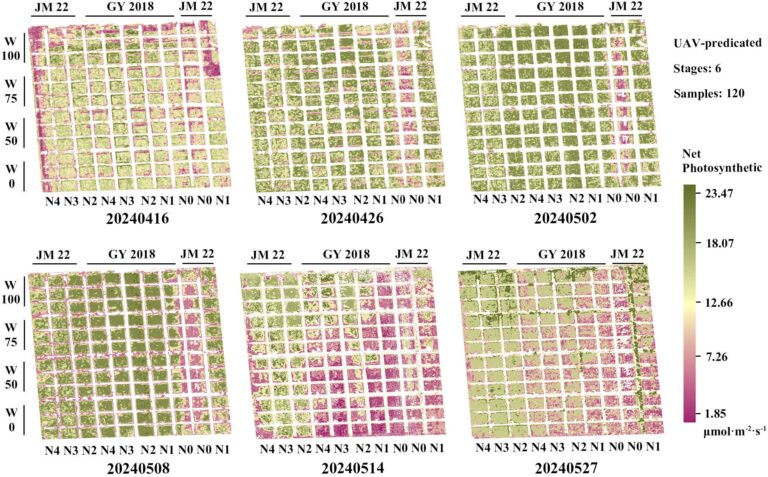
In the second experiment, the team collected canopy reflectance using a DJI M300 UAV carrying an X20 Pro hyperspectral camera. The imagery underwent white-reference and dark-current calibration before processing.
To apply the model, the researchers addressed differences between the UAV inputs and the data used for training. They matched the wavelengths required for vegetation-index calculations to the nearest available UAV channels and preserved the order of the model’s input features.
They also standardized the UAV-derived index values, then rescaled them using the means and standard deviations of the training data. The authors describe this distribution alignment as a way to address differences associated with sensing platform and growing season.
The resulting maps showed variation in predicted net photosynthetic rate across observation dates, nitrogen treatments and two wheat cultivars. At the same growth stage, plots receiving more nitrogen generally showed higher predicted values than low-nitrogen plots. Irrigation-related differences were also detectable, although less pronounced than the nitrogen-treatment contrasts.
The authors noted reduced reliability during late senescence and severe nitrogen deficiency. They propose further work on soil-background removal and additional inputs, including image texture, thermal infrared data and chlorophyll fluorescence.
Linking ground measurements with wider coverage
The study’s central contribution is a framework connecting field spectroradiometer measurements with UAV hyperspectral imagery. The HR-1024i supplied the leaf reflectance used in model development, while the UAV imagery enabled spatial mapping in the later experiment.
The authors conclude that their approach demonstrates the feasibility of combining ground measurements with aerial monitoring of winter wheat net photosynthetic rate. The framework brings together the leaf-level measurements used to develop the model and the wider coverage available from aerial imagery.
For this study, extending the model beyond individual leaves required both spectral measurements and explicit adjustment of the aerial inputs. That sequence is the basis of the reported connection between leaf-level observations and field-scale photosynthesis estimates.
From Leaf Measurements to Field Insights
Frequently Asked Questions
How was the SVC HR-1024i used?
The researchers used it to collect leaf hyperspectral reflectance in the first experiment. Those observations were paired with separately measured net photosynthetic rate for model development.
Which model performed best?
The authors identified the vegetation-index, SPA and random-forest combination as the best-performing configuration. Figure 8 and the conclusion report a validation R² of 0.8457 and RMSE of 2.4299 μmol m⁻² s⁻¹.
How did the researchers apply the leaf model to UAV imagery?
They matched spectral channels, kept model inputs in the required order, and standardized and rescaled UAV-derived vegetation indices using the training data’s statistics before generating spatial maps.
Source
Dai, M., Gu, L., Zhang, B., Bao, X., Ren, Y., Xiong, S., Zhen, W., and Gu, X. (2026). “Transferable spectral models for high-throughput estimation of winter wheat net photosynthetic rate: a cross-scale approach using leaf and UAV hyperspectral data.” Frontiers in Plant Science, 17:1948151. DOI: 10.3389/fpls.2026.1948151. Supplied file: pmc13582206.pdf.